 Web Server Statistics for woop.ca Web Server Statistics for woop.ca
(Go To: Top: General Summary: Daily Summary: Hourly Summary: Domain Report: Organization Report: Operating System Report: Status Code Report: File Size Report: File Type Report: Directory Report: Request Report)
This report contains overall statistics.
Successful requests: 2,260
Average successful requests per day: 2,260
Successful requests for pages: 2,124
Average successful requests for pages per day: 2,124
Failed requests: 858
Redirected requests: 13
Distinct files requested: 572
Distinct hosts served: 349
Corrupt logfile lines: 29
Data transferred: 596.14 megabytes
Average data transferred per day: 596.56 megabytes
(Go To: Top: General Summary: Daily Summary: Hourly Summary: Domain Report: Organization Report: Operating System Report: Status Code Report: File Size Report: File Type Report: Directory Report: Request Report)
This report lists the total activity for each day of the week, summed over all the weeks in the report.
Each unit ( ) represents 50 requests
for pages or part thereof.
) represents 50 requests
for pages or part thereof.
day: #reqs: #pages:
---: -----: ------:
Sun:     0:      0:
Mon:     0:      0:
Tue:     0:      0:
Wed:     0:      0:
Thu:     0:      0:
Fri:     0:      0:
Sat:  2260:   2124:
(Go To: Top: General Summary: Daily Summary: Hourly Summary: Domain Report: Organization Report: Operating System Report: Status Code Report: File Size Report: File Type Report: Directory Report: Request Report)
This report lists the total activity for each hour of the day, summed over all the days in the report.
Each unit () represents 3 requests
for pages or part thereof.
hour: #reqs: #pages: ----: -----: ------: 0: 117: 111:2: 52: 45:
4: 103: 84:
14: 108: 105:
(Go To: Top: General Summary: Daily Summary: Hourly Summary: Domain Report: Organization Report: Operating System Report: Status Code Report: File Size Report: File Type Report: Directory Report: Request Report)
This report lists the countries of the computers which requested files.
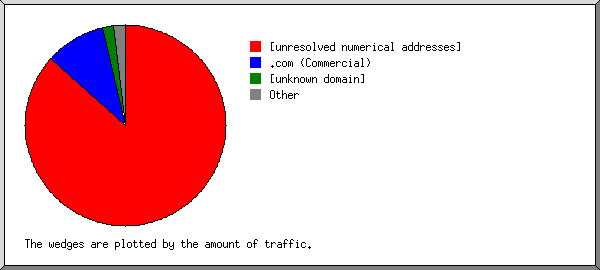
Listing domains, sorted by the amount of traffic.
#reqs: %bytes: domain
-----: ------: ------
  532: 60.88%: .ru (Russia)
 1114: 28.92%: [unresolved numerical addresses]
  508:  5.39%: .com (Commercial)
   24:  2.13%: .net (Networks)
   59:  1.13%: [unknown domain]
   11:  0.62%: .de (Germany)
    3:  0.35%: .ca (Canada)
    3:  0.35%: .br (Brazil)
    1:  0.12%: .vn (Vietnam)
    1:  0.12%: [domain not given]
    1:       : .fr (France)
    1:       : .ec (Ecuador)
    1:       : .es (Spain)
    1:       : .uk (United Kingdom)
(Go To: Top: General Summary: Daily Summary: Hourly Summary: Domain Report: Organization Report: Operating System Report: Status Code Report: File Size Report: File Type Report: Directory Report: Request Report)
This report lists the organizations of the computers which requested files.
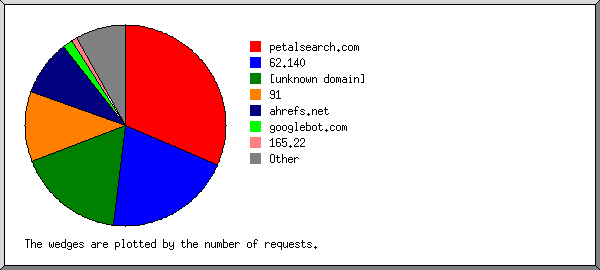
Listing the top 20 organizations by the number of requests, sorted by the number of requests.
#reqs: %bytes: organization
-----: ------: ------------
  647: 23.16%: 5
  531: 60.78%: ertelecom.ru
  334:  1.42%: petalsearch.com
  220:       : 91
  102:  0.24%: semrush.com
   59:  1.13%: [unknown domain]
   45:  0.28%: 43
   30:  0.33%: 216.244
   24:  0.82%: amazonaws.com
   20:  0.02%: 154.58
   14:  1.56%: revivenode.com
   13:  1.43%: datawagon.net
    9:  0.23%: 47
    8:  0.35%: your-server.de
    7:  0.01%: googlebot.com
    6:       : 142.93
    6:  0.35%: contaboserver.net
    6:       : 49
    5:  0.02%: 137.184
    5:  0.34%: colocrossing.com
  169:  7.52%: [not listed: 106 organizations]
(Go To: Top: General Summary: Daily Summary: Hourly Summary: Domain Report: Organization Report: Operating System Report: Status Code Report: File Size Report: File Type Report: Directory Report: Request Report)
This report lists the operating systems used by visitors.
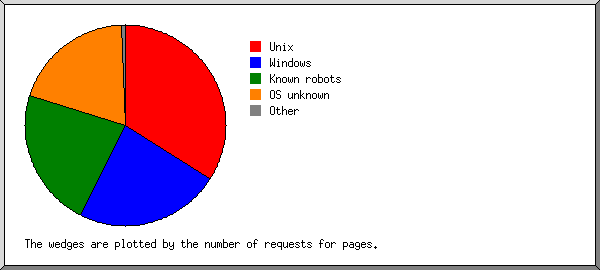
Listing operating systems, sorted by the number of requests for pages.
 #: #reqs: #pages: OS
--: -----: ------: --
 1:  1491:   1444: Windows
  :  1269:   1222:   Windows NT
  :   222:    222:   Unknown Windows
 2:   369:    352: Unix
  :   369:    352:   Linux
 3:   248:    217: OS unknown
 4:   107:    104: Macintosh
 5:    34:      5: Known robots
(Go To: Top: General Summary: Daily Summary: Hourly Summary: Domain Report: Organization Report: Operating System Report: Status Code Report: File Size Report: File Type Report: Directory Report: Request Report)
This report lists the HTTP status codes of all requests.
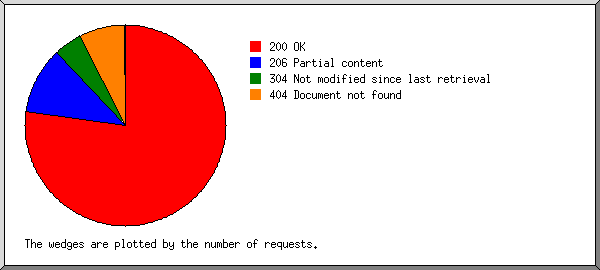
Listing status codes, sorted numerically.
#reqs: status code
-----: -----------
 2025: 200 OK
  233: 206 Partial content
   13: 301 Document moved permanently
    2: 304 Not modified since last retrieval
  858: 404 Document not found
(Go To: Top: General Summary: Daily Summary: Hourly Summary: Domain Report: Organization Report: Operating System Report: Status Code Report: File Size Report: File Type Report: Directory Report: Request Report)
This report lists the sizes of files.
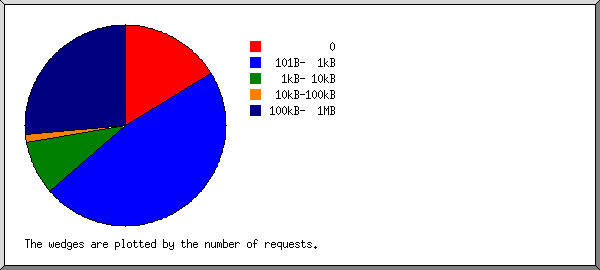
       size: #reqs: %bytes:
-----------: -----: ------:
          0:   222:       :
   1B-  10B:     0:       :
  11B- 100B:     3:       :
 101B-  1kB:   449:  0.04%:
  1kB- 10kB:   218:  0.14%:
 10kB-100kB:    35:  0.17%:
100kB-  1MB:  1333: 99.65%:
(Go To: Top: General Summary: Daily Summary: Hourly Summary: Domain Report: Organization Report: Operating System Report: Status Code Report: File Size Report: File Type Report: Directory Report: Request Report)
This report lists the extensions of files.
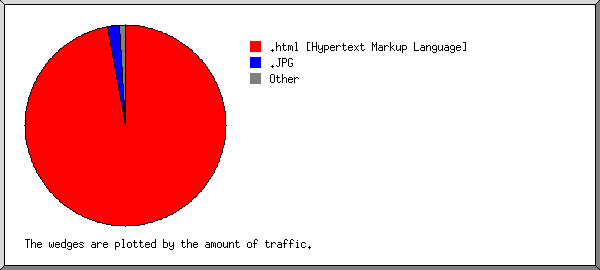
Listing extensions with at least 0.1% of the traffic, sorted by the amount of traffic.
#reqs: %bytes: extension
-----: ------: ---------
 1774: 99.12%: .html [Hypertext Markup Language]
   17:  0.44%: .JPG
   98:  0.22%: .jpg  [JPEG graphics]
  350:  0.14%: [directories]
   21:  0.08%: [not listed: 4 extensions]
(Go To: Top: General Summary: Daily Summary: Hourly Summary: Domain Report: Organization Report: Operating System Report: Status Code Report: File Size Report: File Type Report: Directory Report: Request Report)
This report lists the directories from which files were requested. (The figures for each directory include all of its subdirectories.)
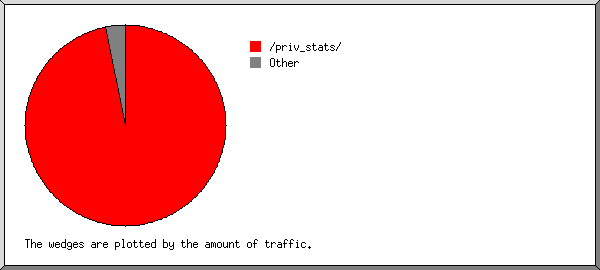
Listing directories with at least 0.01% of the traffic, sorted by the amount of traffic.
#reqs: %bytes: directory
-----: ------: ---------
 1318: 99.06%: /priv_stats/
   84:  0.14%: /Portugal2009/
  151:  0.10%: /Portugal2003/
   67:  0.09%: /Portugal2006/
  102:  0.08%: /halifax/
    5:  0.07%: /house/
   17:  0.07%: /riding_mountain/
    5:  0.07%: /caddy_lake/
  265:  0.06%: [root directory]
    2:  0.06%: /images/
  119:  0.05%: /honeymoon/
    4:  0.04%: /sunrise/
   51:  0.04%: /xfree/
    6:  0.03%: http://
   46:  0.02%: /wedding/
    9:  0.01%: /freak/
    9:       : [not listed: 2 directories]
(Go To: Top: General Summary: Daily Summary: Hourly Summary: Domain Report: Organization Report: Operating System Report: Status Code Report: File Size Report: File Type Report: Directory Report: Request Report)
This report lists the files on the site.
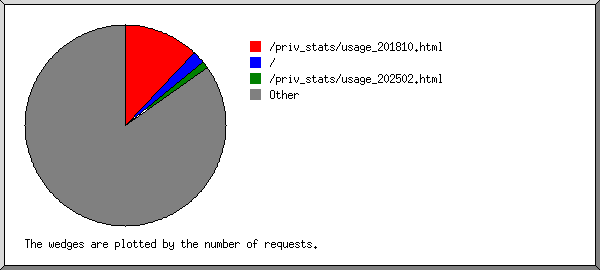
Listing files with at least 20 requests, sorted by the number of requests.
#reqs: %bytes:          last time: file
-----: ------: ------------------: ----
  648: 23.27%: Jul/25/26  8:41 PM: /priv_stats/usage_202512.html
  565: 64.67%: Jul/25/26 11:59 PM: /priv_stats/usage_202607.html
  254:  0.03%: Jul/25/26 11:51 PM: /
   67:  7.55%: Jul/25/26  9:53 PM: /priv_stats/usage_202606.html
  726:  4.48%: Jul/25/26 11:57 PM: [not listed: 566 files]
(Go To: Top: General Summary: Daily Summary: Hourly Summary: Domain Report: Organization Report: Operating System Report: Status Code Report: File Size Report: File Type Report: Directory Report: Request Report)


